Alternative performance measures
SoftwareOne has defined a set of non-IFRS, or alternative, financial measures, which reflect the company’s internal approach to analysing its performance and which are also disclosed externally. These measures allow key decision makers at SoftwareOne to manage the company and make investment decisions. The company believes that such measures are also frequently used by external stakeholders such as sell-side research analysts, investors, and other interested parties to evaluate peers in the same industry.
Results overview
Link to full overview of SoftwareOne's consolidated financial statements
Profit & loss summary
|
|
|
|
|
|
|
|
|
|
|
Reported |
|
Adjusted |
||||
|
in CHF million |
2023 |
2022 |
|
2023 |
2022 |
% Δ |
% Δ at CCY |
|
Revenue from Software & Cloud Marketplace |
549.8 |
538.4 |
|
549.7 |
545.3 |
0.8 % |
5.6 % |
|
Revenue from Software & Cloud Services |
461.5 |
437.4 |
|
461.2 |
437.4 |
5.4 % |
11.0 % |
|
Total revenue |
1,011.3 |
975.8 |
|
1,010.9 |
982.8 |
2.9 % |
8.0 % |
|
Delivery costs |
– |
– |
|
–347.6 |
–346.3 |
0.4 % |
5.3 % |
|
Contribution margin |
– |
– |
|
663.3 |
636.4 |
4.2 % |
9.4 % |
|
SG&A |
– |
– |
|
–418.1 |
–396.0 |
5.6 % |
11.2 % |
|
EBITDA |
161.7 |
136.9 |
|
245.2 |
240.4 |
2.0 % |
6.5 % |
|
Depreciation, amortisation and impairment 1) |
–65.9 |
–58.6 |
|
–65.9 |
–58.6 |
12.6 % |
– |
|
EBIT |
95.8 |
78.4 |
|
179.3 |
181.9 |
–1.4 % |
– |
|
Net financial items |
–33.3 |
–92.4 |
|
–24.4 |
–14.7 |
66.0 % |
– |
|
Earnings before tax |
62.5 |
–14.0 |
|
154.9 |
167.2 |
–7.4 % |
– |
|
Income tax expense |
–41.0 |
–44.3 |
|
–45.3 |
–52.2 |
–13.2 % |
– |
|
Profit for the year |
21.4 |
–58.3 |
|
109.6 |
115.0 |
–4.7 % |
– |
|
|
|
|
|
|
|
|
|
|
EBITDA margin (% revenue) |
16.0 % |
14.0 % |
|
24.3 % |
24.5 % |
(0.2)pp |
– |
|
EPS (diluted) |
0.14 |
–0.38 |
|
0.70 |
0.74 |
–4.9 % |
– |
1) Includes PPA amortisation (including impairments, if applicable) of CHF 14.5 million and CHF 15.9 million in 2023 and 2022, respectively
Reconciliation – IFRS reported to Adjusted profit
|
in CHF million |
2023 |
2022 |
|
IFRS reported profit for the period |
21.4 |
–58.3 |
|
Impact of change in revenue recognition of Microsoft Enterprise Agreements |
–0.2 |
6.6 |
|
Share-based compensation |
– |
4.3 |
|
Integration expenses, M&A and earn-out expenses |
23.1 |
44.3 |
|
Russia related-loss |
–0.3 |
35.2 |
|
Restructuring expenses |
39.3 |
13.1 |
|
Discontinuation of MTWO vertical |
5.7 |
– |
|
Other non-recurring items |
15.9 |
– |
|
Total revenue and operating expense adjustments |
83.5 |
103.5 |
|
Depreciation / (appreciation) of Crayon and impact of adjustments on financial result |
8.9 |
77.7 |
|
Tax impact of adjustments |
–4.3 |
–7.9 |
|
Adjusted profit for the year |
109.6 |
115.0 |
Source: Management view
Non-IFRS financial measures and group key performance indicators (KPIs)
The group presents non-IFRS financial measures used by management to monitor the company’s performance, which may be helpful for external stakeholders in evaluating SoftwareOne’s financial results compared to industry peers. They include the following:
Adjusted EBITDA is defined as the underlying earnings before net financial items, tax, depreciation, and amortisation, adjusted for items affecting comparability in operating expenses.
Adjusted EBITDA margin is defined as adjusted EBITDA divided by revenue.
Adjusted profit for the period is defined as the (loss)/profit for the period, adjusted for items impacting comparability in operating expenses and net finance income/(expenses) as well as the related tax impact.
Contribution margin is defined as total revenue net of third-party service delivery costs and directly attributable internal delivery costs.
Free cash flow is defined as the group net cash generated from/ (used in) operating activities, plus net cash from/ (used in) investing activities, minus net cash from acquisition of businesses (net of cash acquired), sale of subsidiary (net of cash disposed) and proceeds from sale of financial assets.
Growth at constant currencies is defined as the change between two periods presented on a constant currency basis for comparability purposes and to assess the group’s underlying performance. Period profit and loss figures are translated from the subsidiaries’ respective local currencies into Swiss francs at the applicable average exchange rate of the prior year period. This calculation is based on the underlying management accounts.
Net debt / (cash)1) comprises group bank overdrafts, other current and non-current financial liabilities less cash and cash equivalents and current financial assets.
Net working capital is defined as the group’s trade receivables, current other receivables, prepayments and contract assets minus trade payables, current other payables and accrued expenses and contract liabilities.
1) Based on new net debt/(cash) definition introduced at H1 2023
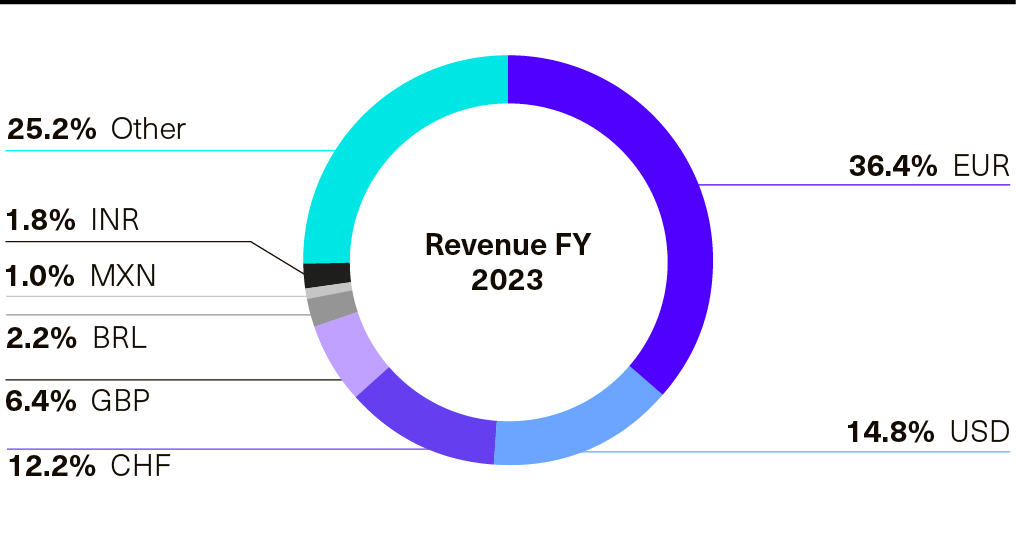
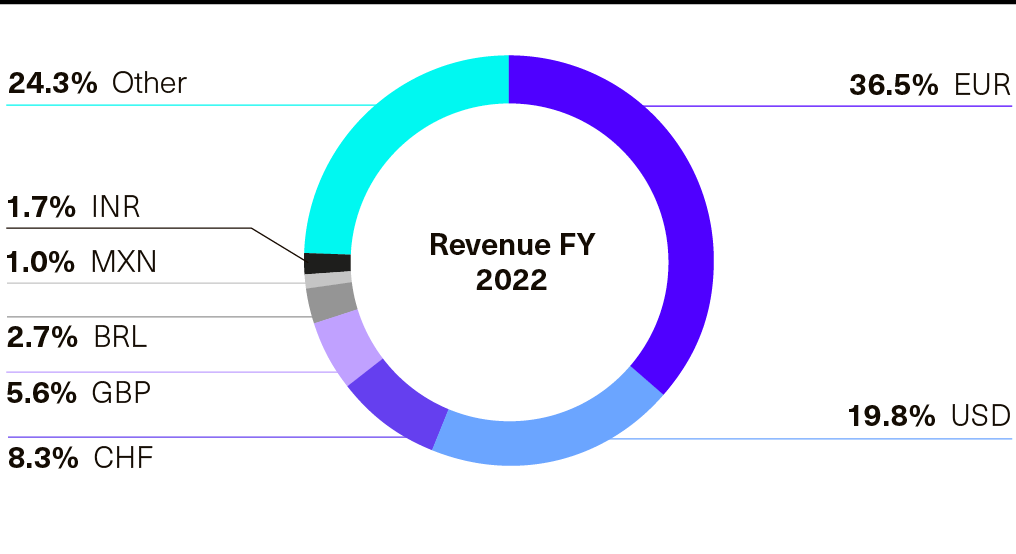
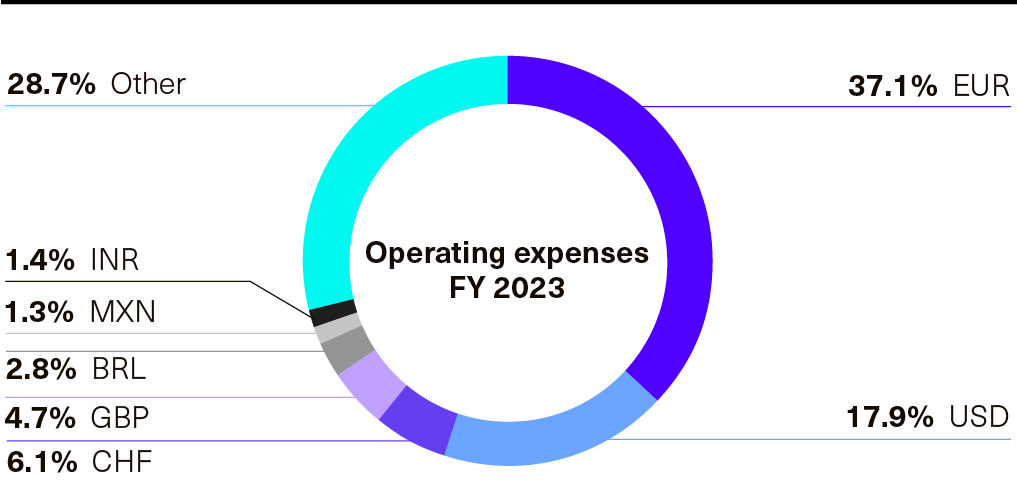
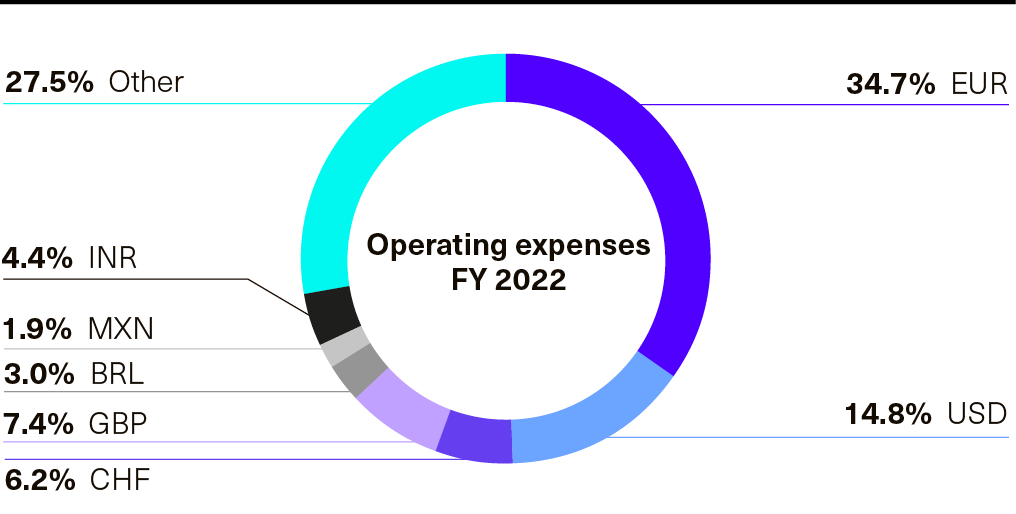
Exchange rates
The table below shows the development of the Swiss franc, SoftwareOne's reporting currency, against major currencies. In addition, the charts provide an overview of the currency breakdowns, including currencies which had the biggest impact on revenues and operating expenses during 2023. Related calculations are based on underlying management accounts and may slightly differ from exchange rates shown in the Consolidated financial statements.
|
CHF to LCY |
2023 |
2022 |
% change |
|
EUR |
1.03 |
1.00 |
3.5 % |
|
USD |
1.11 |
1.05 |
6.2 % |
|
CHF |
1.00 |
1.00 |
0.0 % |
|
GBP |
0.90 |
0.85 |
5.6 % |
|
BRL |
5.59 |
5.40 |
3.4 % |
|
MXN |
19.76 |
21.15 |
–6.6 % |
|
INR |
92.25 |
82.21 |
12.2 % |
FX exposure
Source: based on management accounts